WARNING
This page is machine-translated by Gemini.
SheepBobbin Console & Logs
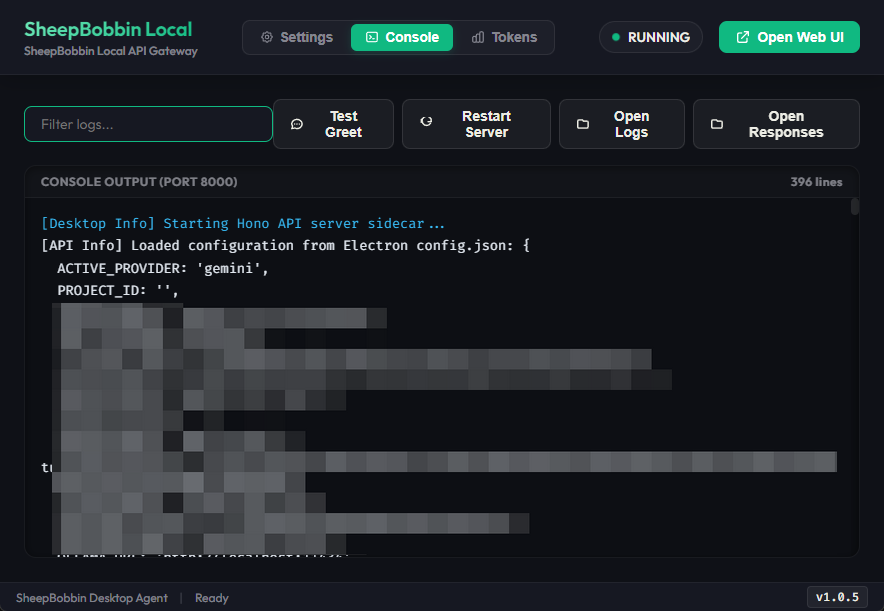
Clicking Console at the top of SheepBobbin opens the console screen. In this view, you can monitor incoming requests from SheepCombWeb or SheepWeave and real-time responses from your connected AI models.
Console Log Granularity
Enabling Enable Request Debug Logs at the very bottom of the Settings screen will output and record detailed diagnostics beyond standard requests/responses, including request headers and processing time.
All information displayed in this console is saved to a file named server.log. Clicking Open Logs at the top opens the directory containing this file, which is invaluable for debugging or auditing past calls.
If you want to review the raw AI outputs rather than network headers and timestamps (e.g., if a connection was interrupted mid-stream), click Open Responses. This folder stores raw response payloads grouped by date in JSONL format.
Tracking Token Consumption
Cloud AI services are generally billed based on token usage. After running batch translation tasks, you will likely want to check how many tokens were consumed. Clicking Tokens in the top navigation allows you to inspect your token statistics.
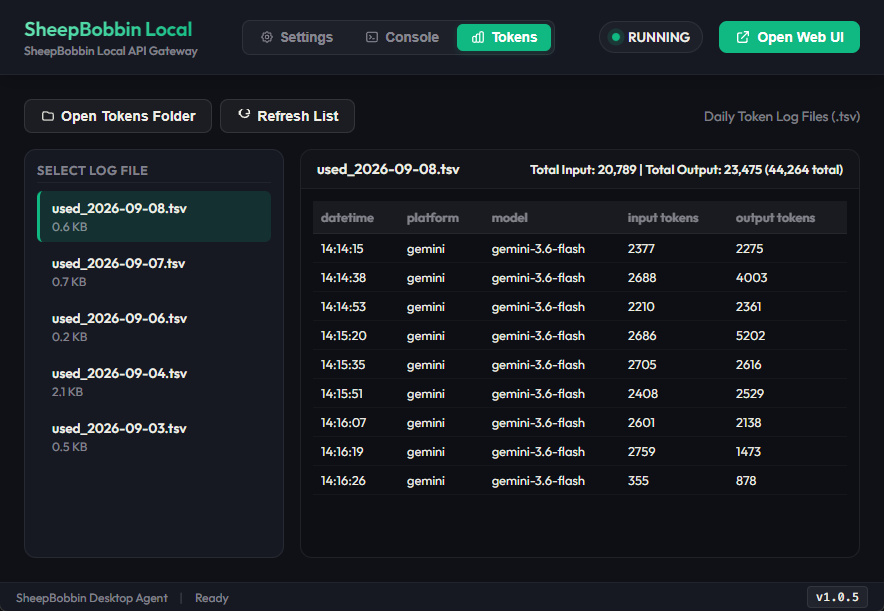
Token usage is aggregated by date and can be previewed by selecting a date from the left menu. Furthermore, token metrics are saved in .tsv format, making it easy to import and aggregate across spreadsheets (Excel, Google Sheets, etc.). To access the raw files directly rather than using the preview pane, click Open Tokens Folder to open the storage directory.